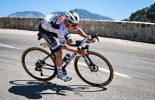
2012 USA Pro Cycling Challenge Stage 3 Rider Performance Analysis
Stage 3 Wednesday, August 22, 2012
Gunnison to Aspen
130.5 miles, 9623' total climbing
Post-Race Overview
Garmin-Sharp took control on Stage 3. Around the midpoint of the stage, eventual stage winner and all-rounder Tom Danielson emerged in a breakaway with teammate David Zabriskie. With Zabriskie's help for part of the way, Danielson emerged over the summit of Independence Pass on his own about 2 and a half minutes ahead of the chase group, which contained then-race leader Tejay van Garderen (BMC Racing Team). Without any teammates left to aid in the chase, van Garderen took the reins and worked hard to bring Danielson back. In the final kilometers the other remaining teams in the lead chase group realized the possibility of victory and took over the chase. Danielson hung on by a mere 2 seconds for the win and teammate Christian Vande Velde took over the race lead.
Stage Results
1 Thomas Danielson (Team Garmin-Sharp) 05:02:06
2 Damiano Caruso (Team Liquigas-Cannondale) 0:00:02
3 Jakob Fuglsang (Team RadioShack-Nissan) 0:00:02
5 Janez Brajkovic (Astana Pro Team 0:00:02
15 Lucas Euser (Spidertech Powered By C10) 0:00:02
19 Timmy Duggan (Team Liquigas-Cannondale) 0:00:02
Timothy Duggan Stats Summary
3496 KJ
194 Average Watts (Average Power)
146 Average Heart Rate
37.98 kph (23.6 mph) Average Speed
Access Full TrainingPeaks Activity Viewer for Timmy Duggan.
Stage Highlights for Timothy Duggan
Consistency is the name of the game. Check out Duggan's power outputs for the two monster climbs today. Duggan averaged 213W for the 4200' climb up Cottonwood Pass, then cranked out 211W up 4000' Independence Pass. Imagine doing a 2-hour climb...then putting out the same power for an identical 2 hour climb immediately after. Detailed stats below:
Cottonwood: 2:02:15, 213W, 45.1 miles (72.7 km) , 4184 ft (1268 m) of climbing, 22 mph (35.7 kph) Average speed.
Independence: 1:55:25, 211W, 42.1 miles (67.9 km), 4022 ft (1219 m) climbing, 21.9 mph (35.3 kph) Average Speed.
Duggan's 20-minute Peak Power for the day is achieved at the top of Independence Pass: 263 average watts, 14.8 mph (23.8 kph) average speed. When you consider that there is 40% less oxygen in the air at 12,000' as there is at sea level, you can see how hard Duggan and the peloton were fighting to catch Danielson.
Chasing all the way to the line: 20-second Peak Power set during the last 20 seconds of the race! 530 Average Watts, 597 Maximum Watts.
Do you want access to the same training data analysis tools as used above? Sign up for your own Roadcycling.com/TrainingPeaks-powered cycling training log. Subscribe to the premium version to gain access to the advanced tools used by pro riders from Team Sky, Team GreenEdge and Team Saxo Bank-Tinkoff Bank.


